Polar graphs can be a good way to represent cyclical data, such as traffic by day of week. In this post I take stack overflow data and plot the usage of tags throughout the week. The method also adds errors to the matplotlib polar plot as a shaded region to help understand the variability in the data. The data is available here ...read more
There are comments.
Pandas date parsing performance
Dates and times provide an unlimited source of hassles for anyone working with them. In this post I'll discuss a potential performance pitfall I encountered parsing dates in pandas. Conclusion: Create DatetimeIndices by parsing data with to_datetime(my_dates, format='my_format').
There are comments.
Analyzing 10 years of digital photography with python and pandas
I recently switched DSLR camera systems from Canon to Nikon for reasons of marital harmony. That meant choosing which Nikon lenses would replace the four Canon lenses I owned. To make an optimal decision I needed to know my historical usage, so I wrote some python to analyze image metadata from 10 years of digital photography.
...read moreThere are comments.
Pandas Timedelta: histograms, unit conversion and overflow danger
The Timedelta object is relatively new to pandas. Recently I worked with Timedeltas but found it wasn't obvious how to do what I wanted. Worse, some operations were seemingly obvious but could easily return the wrong answer (update: this issue was fixed in pandas version 0.17.0). Here I go through a few Timedelta
...read more
There are comments.
GitHub now renders Jupyter (IPython) notebooks
I just noticed that GitHub now renders Jupyter (IPython) notebooks when you view the file. This is great! See GitHub's post

There are comments.
First Look at AWS Machine Learning
Amazon Web Services recently announced Amazon Machine Learning, promising to make large scale machine learning more accessible to non-experts. I was curious to try out this service so I fed it some weather data from Oakland International Airport to see how well and …
...read moreThere are comments.
Pandas 0.16.0 released
Pandas 0.16.0 was released this week. Version 0.16.0 includes a new .assign() method of DataFrames, which I'll use on some real world automobile MPG data below (data file).
There are comments.
Analyzing large xml files in python
To show some techniques for working with files that are too large to fit on memory, I'm writing this post on a 10 year old laptop with 512 Mb of RAM and a 1.2 GHz celeron processor. The data in question is an xml format dump of data from …
...read moreThere are comments.
IPython 3.0 released
IPython 3.0 has been released, with notable changes to the IPython Notebook, which is now evolving into the language-agnostic Project Jupyter.
I think some of the new nbconvert tools will be useful:
...read more
- Added a .ipynb exporter to nbconvert. It can be used by passing --to notebook as a commandline …
There are comments.
Saving time and space by working with gzip and bzip2 compressed files in python
File compression tools like gzip and bzip2 can compress text files into a fraction of their size, often to as little as 20% of the original. Data files often come compressed to save storage space and network bandwidth. A typical workflow is to uncompress the file before analysis, but it can be more convenient to leave the file in its compressed form, especially if the uncompressed file would take up a significant amount of space. In this post I'll show how to work directly with compressed files in python.
There are comments.
SF Python meetup talk
I gave a lighting talk at the SF Python meeting tonight about the recommender system I wrote to generate the "Similar Posts" links on this site. The slides are up here.
...read moreThere are comments.
Analysis of Shakespeare character speech topics
In Part I of this post I made a topic model of the speech of Shakespeare characters from eight plays. Here in Part II I'll analyze the results of the model. Download notebook.
There are comments.
Topic modeling of Shakespeare characters
In this post I extract all the words spoken by each character in eight of Shakespeare's plays. Then I construct a topic model to see which characters are generally speaking about similar things. In Part II I look into the information revealed by the topic model. Download notebook.
There are comments.
Annotating matplotlib plots
To extend on my post about plotting and reshaping data from the BART API, I worked a bit with the matplotlib annotion interface to add text and arrows to a plot. The meat of this post is in cell #4 below. Download notebook.
There are comments.
Cleaning, reshaping, and plotting BART time series data with pandas
Introduction
I recently starting collecting data from the BART API, specifically estimated time to departure for trains at the two stations I use most frequently. In this notebook I'll show how I parsed the data from a csv file, reshaped it to fit the questions at hand, and made a few plots. Download notebook ...read more
There are comments.
When joins go wrong, check data types
Writing and debugging joins can be especially difficult when dealing with data from text files. In some cases there is no resulting data, or (much harder to notice!) a few lines that should be included are dropped. Here I'll go into an example of a failed join in pandas, and …
...read moreThere are comments.
Installing python for data science
Installing all the python libraries required for data science can be a challenge, especially on windows machine. Unfortunately the same thing that makes the libraries fast also makes them difficult to distribute to different system types. Luckily there are a few free options for getting up and running painlessly. I …
...read moreThere are comments.
Using topic modeling to find related blog posts
Over the weekend I got curious about how different posts in this blog were similar to each other, and thought about putting links to similar posts at the end of each article. I used the gensim python library (topic modeling for humans) to find similar articles and I wrote a …
...read moreThere are comments.
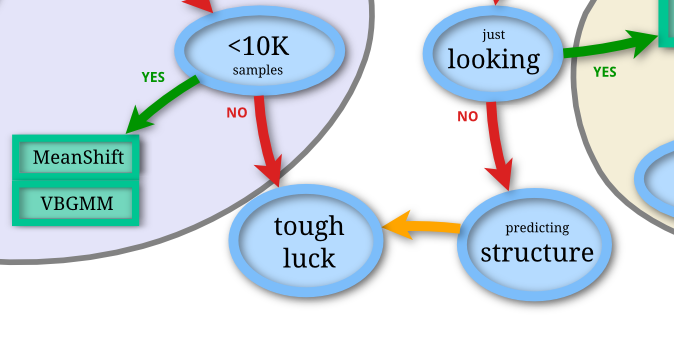
Scikit-learn machine learning algorithm flowchart
Scikit-learn has a nice flowchart of when to use different machine learning algorithms. View the whole chart here.
There are comments.
Page 1 / 2 »