pandas has a lot of lifesaving features for dealing with dates. Here's an example timeseries data file, which happens contains a missing date:
date,temp
11-1-2014,56
11-2-2014,56
11-3-2014,59
11-5-2014,60
11-6-2014,55
Loading and plotting the data in pandas gives this result:
In [0]: %matplotlib inline

In [1]: import matplotlib.pyplot as plt

In [2]: import pandas as pd

In [3]: df = pd.read_csv('timeseries.txt', index_col=0)

In [4]: df
Out[4]:
            temp
date
2014-11-01    56
2014-11-02    56
2014-11-03    59
2014-11-05    60
2014-11-06    55

[5 rows x 1 columns]

In [5]: df.index
Out[5]:
Index([u'11-1-2014', u'11-2-2014', u'11-3-2014', u'11-5-2014', u'11-6-2014'], dtype='object')

In [6]: df.plot(marker='o', ylim=[50, 65]); plt.ylabel("Temperature (F)")
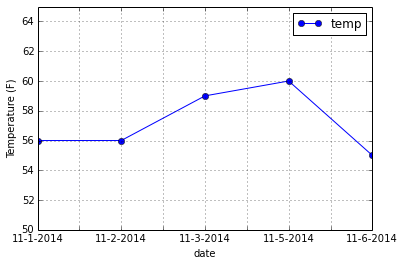
Notice that even though Nov. 3rd and Nov. 5th are a day apart those two dates are not separated by any extra distance on the graph. This is because pandas understood the data in the date column as strings, not as dates. This is confirmed by the df.index command above showing the index is made up of strings. Luckily it's easy to have pandas parse dates from this column by adding the parse_dates=True parameter to read_csv():
In [7]: df = pd.read_csv('timeseries.txt', index_col=0, parse_dates=True)

In [8]: df.index  # should now be a DateTimeIndex
Out[8]:
<class pandas.tseries.index.DatetimeIndex>
[2014-11-01 00:00:00, ..., 2014-11-06 00:00:00]
Length: 5, Freq: None, Timezone: None

In [9]: df.plot(marker='o', ylim=[50, 65]); plt.ylabel("Temperature (F)")
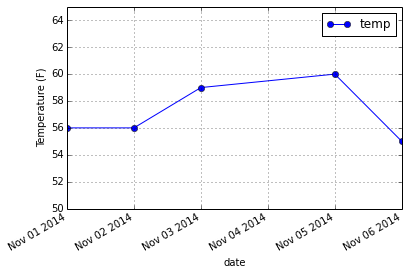
Now the plot has the correct spacing. Pandas understood that the dates should be spaced according the amount of time between them, not according to their index.
Going back to our DataFrame, it's also easy to add rows for missing data and fill them with NaNs or the last known value (pad/forward fill) or next known (back fill) value.
In [10]: df
Out[10]:
            temp
date
2014-11-01    56
2014-11-02    56
2014-11-03    59
2014-11-05    60
2014-11-06    55

[5 rows x 1 columns]

In [11]: resampled_df = df.resample('D')

In [12]: resampled_df  # missing dates now have NaN values
Out[12]:
            temp
date
2014-11-01    56
2014-11-02    56
2014-11-03    59
2014-11-04   NaN
2014-11-05    60
2014-11-06    55

[6 rows x 1 columns]

In [13]: resampled_ffill_df = df.resample('D', fill_method='ffill')

In [14]: resampled_ffill_df  # missing data filled with last known value
Out[14]:
            temp
date
2014-11-01    56
2014-11-02    56
2014-11-03    59
2014-11-04    59
2014-11-05    60
2014-11-06    55

[6 rows x 1 columns]
Read more about dealing with dates in pandas here on the pandas site.
Similar Posts
- Annotating matplotlib plots, Score: 0.998
- Cleaning, reshaping, and plotting BART time series data with pandas, Score: 0.991
- Polar plots and shaded errors in matplotlib, Score: 0.983
- Pandas Timedelta: histograms, unit conversion and overflow danger, Score: 0.974
- Analyzing 10 years of digital photography with python and pandas, Score: 0.938
Comments